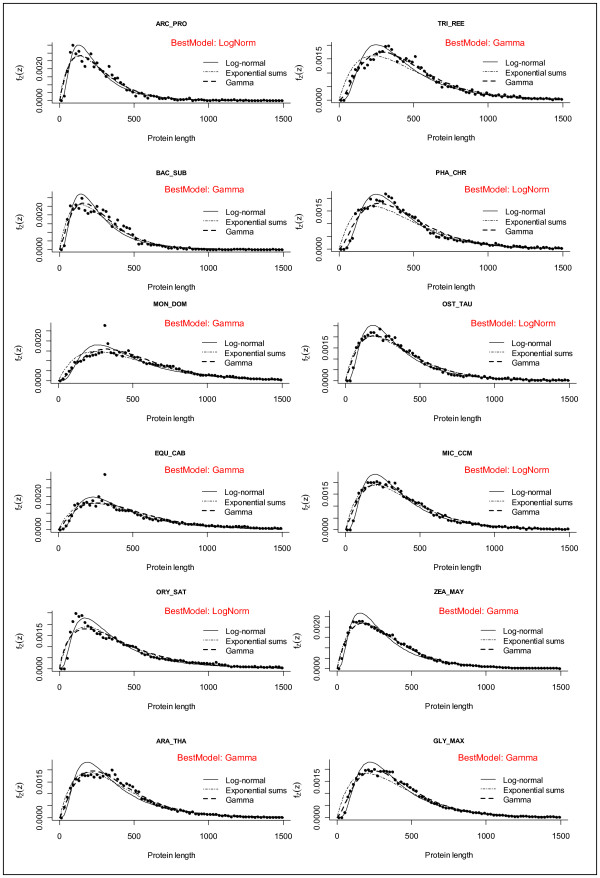
Figure 10.
Fitting to theoretical distributions. Protein length distributions for 12 typical genomes: Archea (Archaeoglobus profundus ARC_PRO), Bacteria (Bacillus subtilis BAC_SUB), Eumetozoa (Equus caballus EQU_CAB, Monodelphis domestica MON_DOM), Fungi (Trichoderma reesei TRI_REE, Phanerochaete chrysosporium PHA_CHR) and Viridiplantae (Ostreococcus tauri OST_TAU, Micromonas CCMP1545 MIC_CCM, Oryza sativa ORY_SAT, Arabidopsis thaliana ARA_THA, Zea mays ZEA_MAY, Glycine max GLY_MAX). The continuous line represents the log-normal fitted model (the corresponding estimated parameters appear in Additional file 1: Table S3) the dots represents the relative frequency counts for the observed data in bins of 10 aa.

