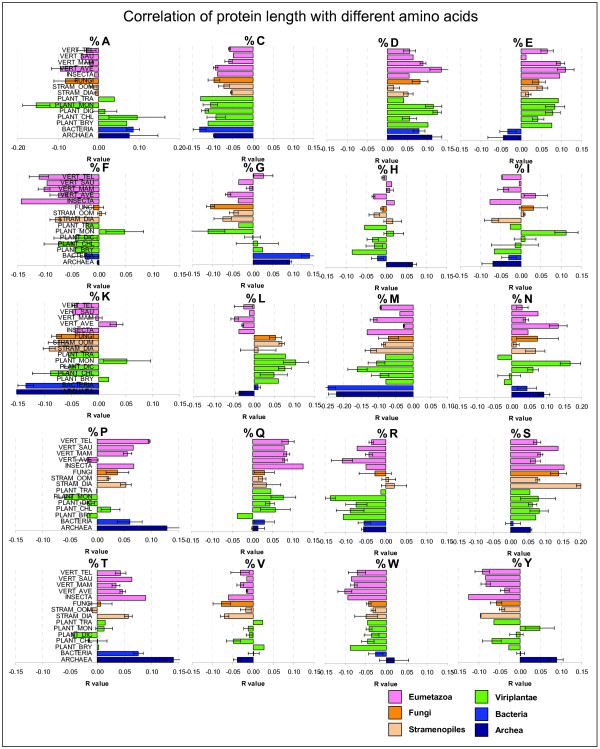
Figure 9.
Protein length amino acid bias. Correlation of percentage amino acid composition with protein length were calculated for each species individually (see Table S4). The pearson correlation coefficients r were then averaged according to taxonomic groups. Bars indicate mean values and standard errors across species of the same taxa. Positive or negative r values indicate the direction of the correlation (e.g. the amino acid C is negatively related to protein length, thus small proteins have more %C than large proteins).

