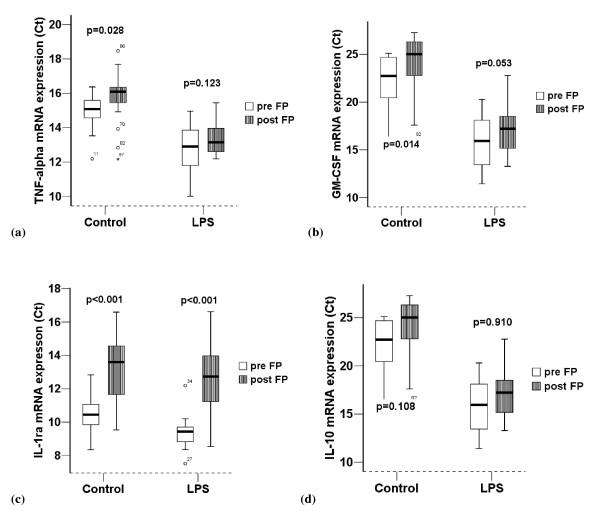
Figure 2.
Comparison of cytokine mRNA expression pre and post FP (n = 22). (a) TNF-α, (b) GM-CSF, (c) IL-1ra, (d) IL-10. Results are normalized for 18S. Ct = threshold cycle. LPS = Lipopolysaccharide. Control = unstimulated sample. Graphical representation is by box and whisker with medians and interquartile ranges. Note: an increase in threshold cycle indicates a decrease in quantity of mRNA present.

