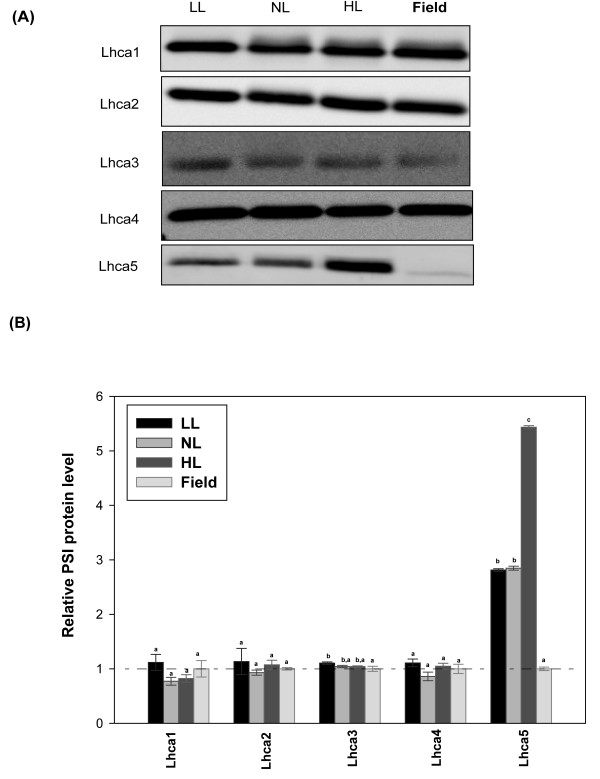
Figure 5.
PSI protein composition of Arabidopsis thaliana in different growth regimes. Plants were grown in climate chambers under Low, Normal or High Light (LL, NL and HL; 30, 300 and 600 μmol quanta m-2 s-1, respectively) and under field conditions. A Results of immunoblot analysis of thylakoid membranes, probed with antibodies against Lhca1, Lhca2, Lhca3 Lhca4 and Lhca5. Lanes were loaded with 1.0 μg chlorophyll. B Quantification of immunoblot data. Error bars indicate SE (n = 3 pools of leaves each from 5-15 plants), the relative abundances of proteins were normalized to the data for field-grown plants. Different lower case letters above bars indicate significant differences (p < 0.001), according to separate Duncan's new multiple range tests followed by contrast analysis (indoor vs. field plants) applied to data presented in each column.

