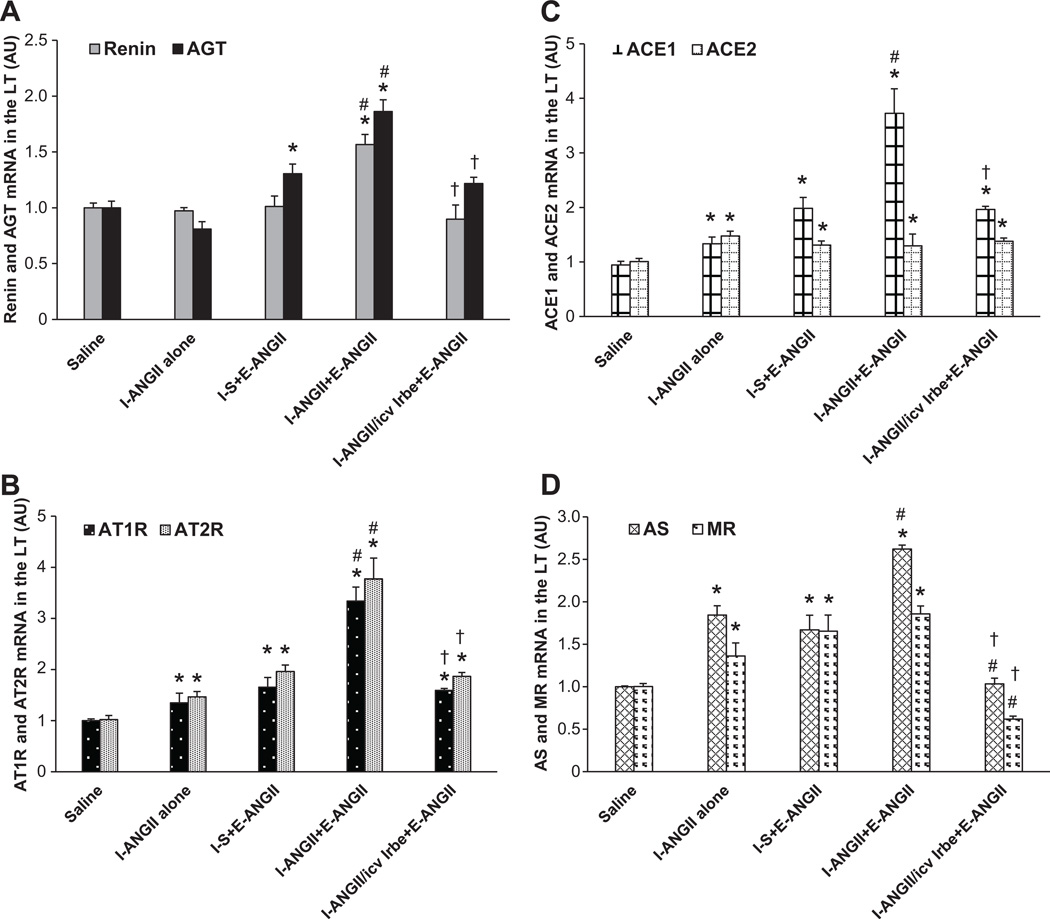
Figure 2.
ANGII infusion induced greater increases in mRNA expression of renin, AGT (Fig 2A), AT1-R, AT2-R (Fig 2B), ACE1 (Fig 2C), and AS (Fig 2D) in the lamina terminalis (LT) of rats receiving a low dose ANGII as compared with those receiving saline during induction (I). Central infusion of AT1-R antagonist blocked these effects. I-S = peripheral treatment with saline during I; I-ANGII = peripheral treatment with a low dose of ANGII during I; I-ANGII/icv Irbe = peripheral treatment with a low dose of ANGII plus central treatment with irbesartan (Irbe) during I; E-ANGII = peripheral treatment with a high dose of ANGII during E. (* p<0.05 vs. saline, # p<0.05 vs. I-ANGII alone or I-S+E-ANGII, † p<0.05 vs. I-ANGII+E-ANGII).

