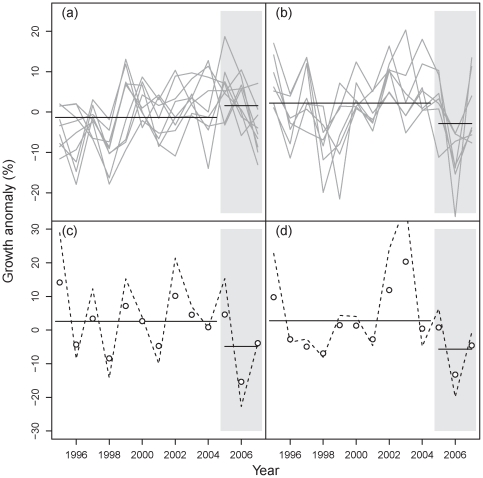
Figure 3. Norway spruce growth anomalies over time.
The upper panels compare growth anomalies (a) for the counties not affected by Gudrun (i.e., Norrbotten-Lappmark, Norrbotten-Kustland, Västerbotten-Lappmark, Västerbotten-Kustland, Jämtland, Västernorrland, Gävle, Dalarna, Värmland) to (b) those that were hit by the storm in January 2005 (see Figure 2). The lower panels give examples of the temporal development of observed growth anomalies (circles) for the counties Jönköping & Kronoberg (c) and Malmöhus, Kristianstad & Blekinge (d) with the fitted interrupted time series models indicated as dashed line. Solid horizontal lines in all panels denote the average growth anomaly in the ten years prior to the storm and in the three years following Gudrun (grey shaded area).

