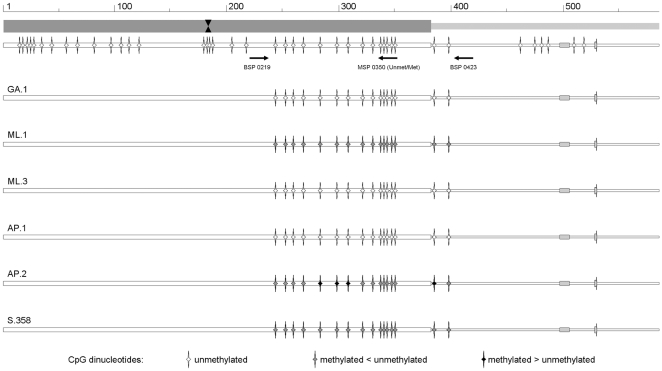
Figure 5. Distribution of CpG methylation in B19V DNA from bioptic samples.
Representative diagrams derived from sequencing chromatograms of the amplification products obtained by means of BSP primers on viral DNA from bioptic samples. Top line, schematic diagram of the left terminal region and proximal part of the internal region of B19V genome, as in Figure 2. BSP and MSP primer positions are indicated. Bottom lines, diagrams indicating the methylation status of CpG dinucleotides as determined by sequencing of BSP amplification products, for the selected samples. The relative abundance of methylated or unmethylated cytosines within CpG dinucleotides is indicated by the gray scale code shown at the bottom of the figure.

