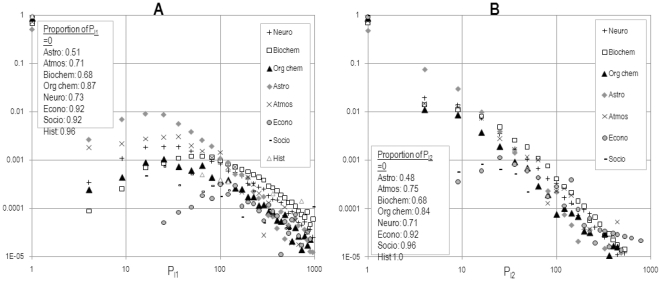
Figure 5.
Distribution of A)  and B)
  (B) for all papers published in 1985 in the disciplines selected. The normalized distribution is computed using a logarithmic binning scheme and the values of the y-intercepts (number of articles which don't cite any level-1 or level-2 co-authors) are listed in each figure.

