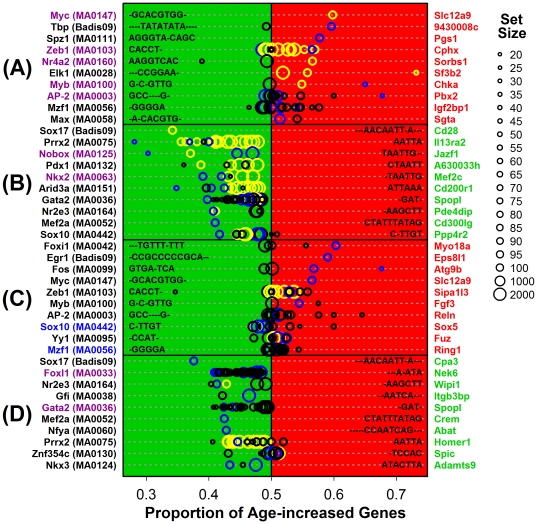
Figure 8. Top-ranked motifs associated with aging effects in mouse tail skin (CB6F1 strain): Overlap with top-ranked human motifs but dissimilar associations with aging.
The chart lists the top-scoring motifs associated with genes (A) increased by aging of tail skin in female mice, (B) decreased by aging of tail skin in female mice, (C) increased by aging of tail skin in males, and (D) decreased by aging of tail skin in males. For each motif (left margin), gene sets associated with a varying number of motif occurrences (in the region 2000 BP upstream/200 BP downstream of the transcription start site) were derived. For any one motif, gene sets with fewer motif occurrences were always larger than those sets containing genes with more motif occurrences (see legend in right margin). Thus, larger symbols correspond to larger gene sets with few motif occurrences while smaller symbols correspond to smaller gene sets with a larger number of motif occurrences (see legend). For each set, the proportion of age-increased to age-decreased genes was calculated (open symbols and horizontal axis; see Figure S3 and S4 legends). A motif-expression association is indicated by deviation of this proportion from 0.50, with blue symbols corresponding to gene sets for which the estimated proportion differs significantly from 0.50 (comparison-wise P<0.05; Fisher's exact test), and yellow symbols corresponding to sets significant at a more stringent threshold (FDR-adjusted P<0.05; Bejamini-Hochberg correction). We noted two motif-aging associations that, for the same sex, were consistent in direction with those identified in humans (blue font; compare with Figures S3 and S4). However, we noted nine associations that, for the same sex, were contrasting in direction compared to those identified in humans (magenta font; compare with Figures S3 and S4). For each motif listed, candidate target genes are listed in the right margin (red labels for age-increased genes; green labels for age-decreased genes; see Figure S3 and S4 legends).

