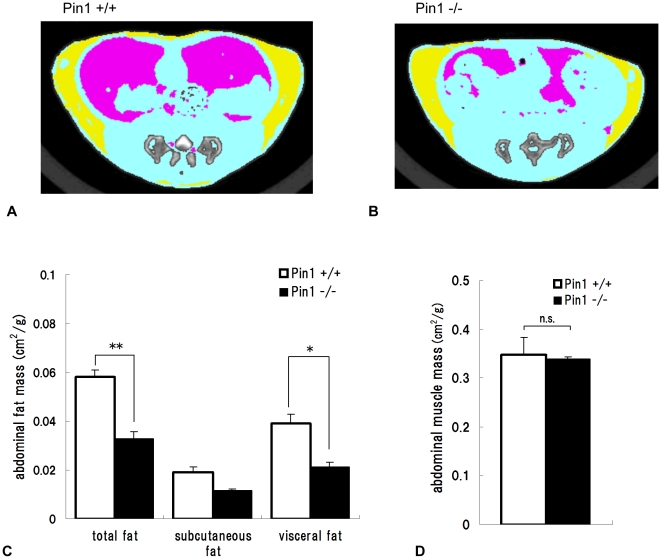
Figure 1. Computed Tomography analysis of wild-type and Pin1−/− mice.
The abdomens of 16 week-old male wild-type (A) and Pin1−/− (B) mice were scanned (yellow; subcutaneous fat, pink; visceral fat, blue; muscle). Quantities of subcutaneous, visceral, and total adipose tissues (**p<0.01) (C), and the other tissues, mainly muscle (D), were measured from the images. The areas were measured from the computer tomography images (cm2) and they were adjusted for body weights of mice (±SEM, n = 3).

