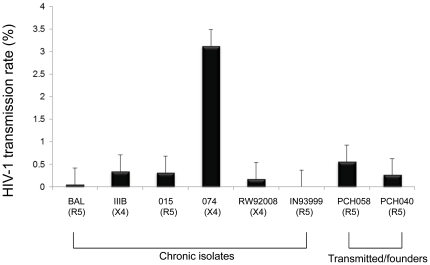
Figure 1. The transmission efficiencies of various HIV-1 inoculums across the cervical mucosa.
The transmission efficiencies were calculated as the percentage of the viral load in the inoculums that were transmitted across cervical mucosa. X axis denotes the isolates (co-receptor usage indicated in the parenthesis) used in this study while Y axis denotes the percentage of the transmission. Data shown here is the average of 3 biopsies with standard error. Isolates are grouped as chronic isolates and transmitter/founders.

