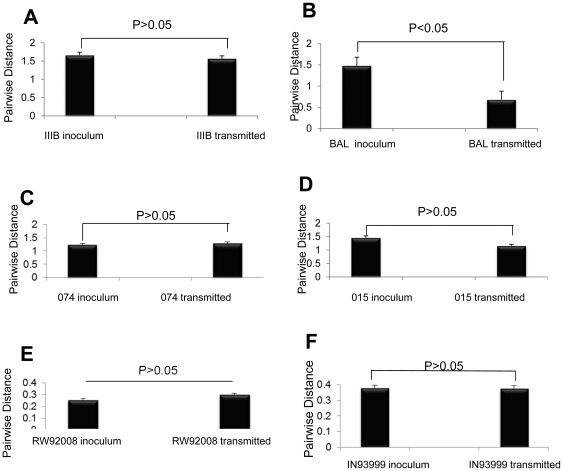
Figure 4. Diversity analysis of the six HIV-1 isolates before and after their mucosal transmission.
Diversity analysis of envelope sequences (C2–V5) from different isolates was performed using MEGA5.0 software. Nucleic acid intra-population diversity was calculated based on nucleotide sequences. The differences between the diversity were plotted as intra-population distances as a function of inoculums and transmitted viruses. Statistical significance of the diversity differences between the inoculums and transmitted viruses was performed using two-sample tests [25]. (A) HIV-1 subtype B, IIIB; (B) HIV-1 subtype B, BAL; (C) HIV-1 subtype B, clinical isolate 074; (D) HIV-1 subtype B, clinical isolate 015, (E) HIV-1 subtype A, RW92008; (F) HIV-1 subtype C isolate, IN93999.

