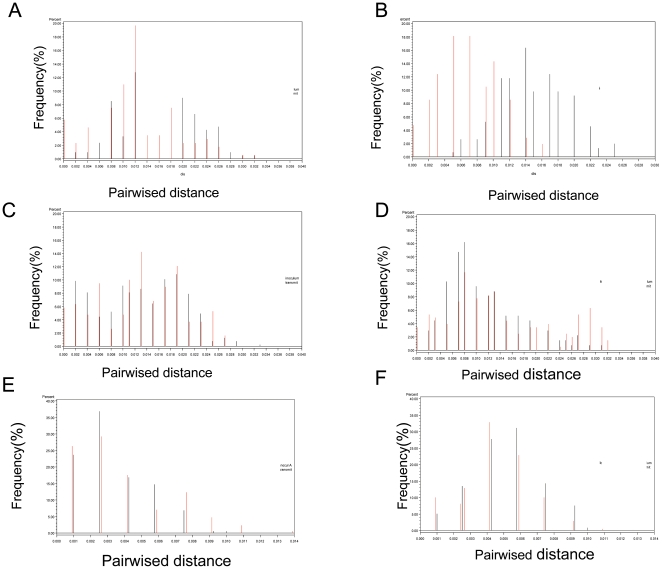
Figure 5. Comparison of distance distribution between the inoculums and the transmitted viral sequences.
The distance distribution for the inoculums and transmitted pairs was shown in pairwise distance histogram. For each pair, the distances between every possibility of pair sequences of inoculums and transmitted variants were calculated respectively. (A) HIV-1 subtype B, IIIB; (B) HIV-1 subtype B, BAL; (C) HIV-1 subtype B, clinical isolate 074; (D) HIV-1 subtype B, clinical isolate 015; (E) HIV-1 subtype A, RW92008; (F) HIV-1 subtype C, IN93999. Black needle bars represent the inoculums pairwise viral sequence distance frequency. Red needle bars represented the transmitted pairwise viral sequence distance frequency.

