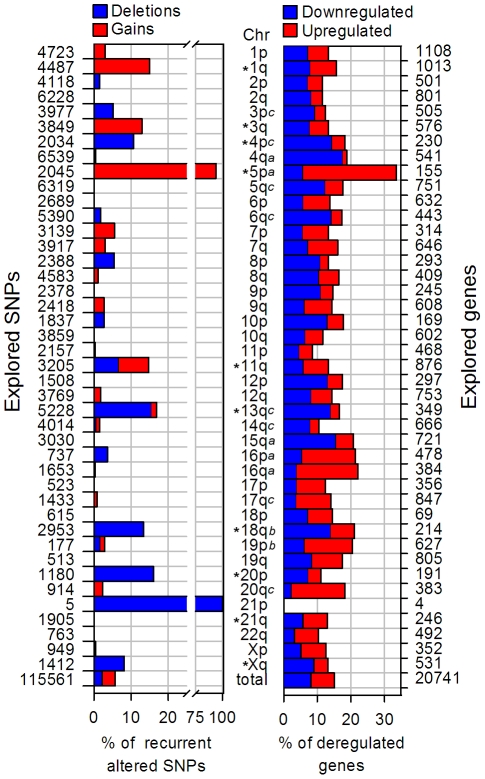
Figure 1. Comparison between copy number changes and gene expression by chromosomal arms.
On the left side, the number of SNPs located in each chromosomal arm is indicated, which were explored by the 100 K microarray. On the right side, the number of genes located in each arm is indicated, which were explored for changes in gene expression by the ST1.0 expression microarray. Each bar represents the percentage of recurrent altered SNPs (left) or deregulated genes (right) common to the 4 cell lines. The chromosomal arms are indicated in the middle column. Arms labeled with asterisks had a mean number of CN-altered SNPs higher and statistically significant (p<0.05, chi-square test) compared with the whole genome means. Arms with a statistically significant deregulated gene enrichment were labeled with “a” (identified with both chi-square test and PAGE), “b” (identified only with chi-square test, p<0.05) or “c” (identified only with PAGE).

