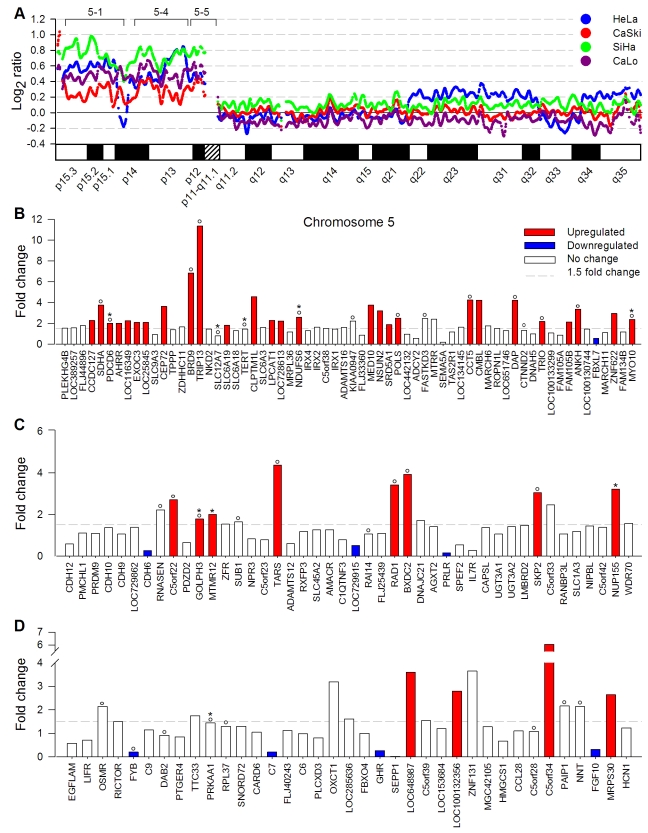
Figure 2. Genome amplification and deregulation of gene expression in Chr 5p.
Panel A shows the copy number log2 ratio of SNPs investigated in Chr 5 by the 100 K SNP microarray in HeLa, CaSki, SiHa, and CaLo. Panels B to D show the fold change of gene expression of genes evaluated by the ST1.0 expression microarray located in MRR 5-1 (n = 64), MRR 5-4 (n = 44), and MRR 5-5 (n = 37) at 5p. The bars represent upregulated genes, downregulated genes, and genes without change in gene expression. The genes are ordered according to position in the genome. The SAM method was used for the analysis, using cut-off values of fold change of ≥1.5 or ≤0.66 for up- or downregulated genes and fold discovery rate (FDR) of 0%. Genes previously reported associated with cervical cancer are labeled with asterisks (IPA system) or circles (PubMed).

