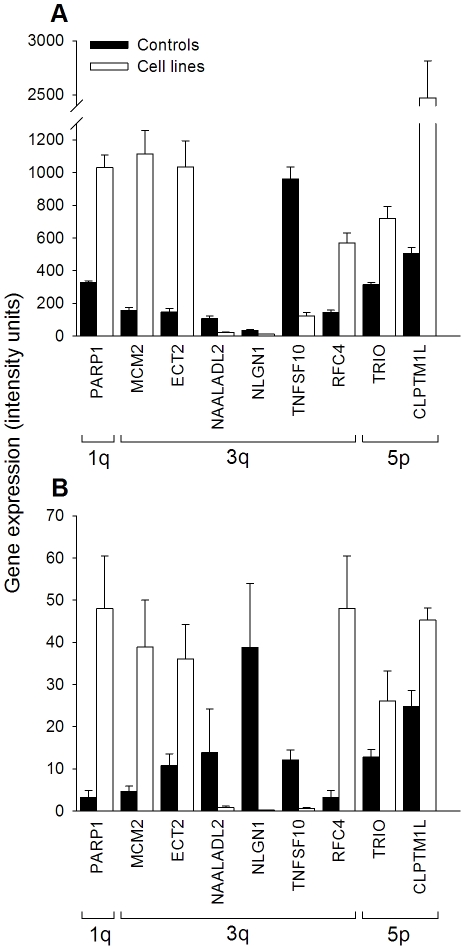
Figure 3. Comparison of gene expression of PARP1, MCM2, ECT2, NAALADL2, NLGN1, TNSF10, RFC4, TRIO and CLPTM1L between cell lines and controls.
Panel A shows the experiments of microarrays and panel B the qRT-PCR experiments. Panels show the mean ± standard error of expression intensity of 9 CN-altered genes located at 1q (PARP1), 3q (MCM2, ECT2, NAALADL2, NLGN1, TNSF10 and RFC4) and 5p (TRIO and CLPTM1L). For both methods intensities are expressed in relative units (see Materials and Methods).

