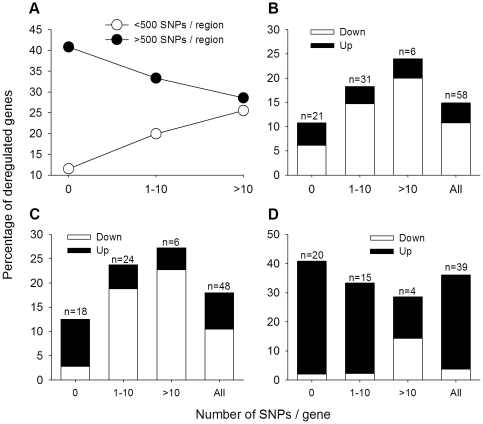
Figure 5. Trend of down- and upregulated genes as CN-altered SNPs/gene increased in deleted and amplified MRRs.
In panel A, the percentage trend of deregulated genes is compared among the genes located in MRRs having 1–100, 101–500, and >500 SNPs. The trends of up- and downregulated genes are shown in panels B (47 deleted MRRs, <500 SNPs), C (51 amplified MRRs, <500 SNPs), and D (2 amplified MRRs, >500 SNPs). The total number of genes studied for expression and included in the analysis of panels B, C, and D was 390, 267, and 108, respectively. The numbers above the bars indicate the number of deregulated genes.

