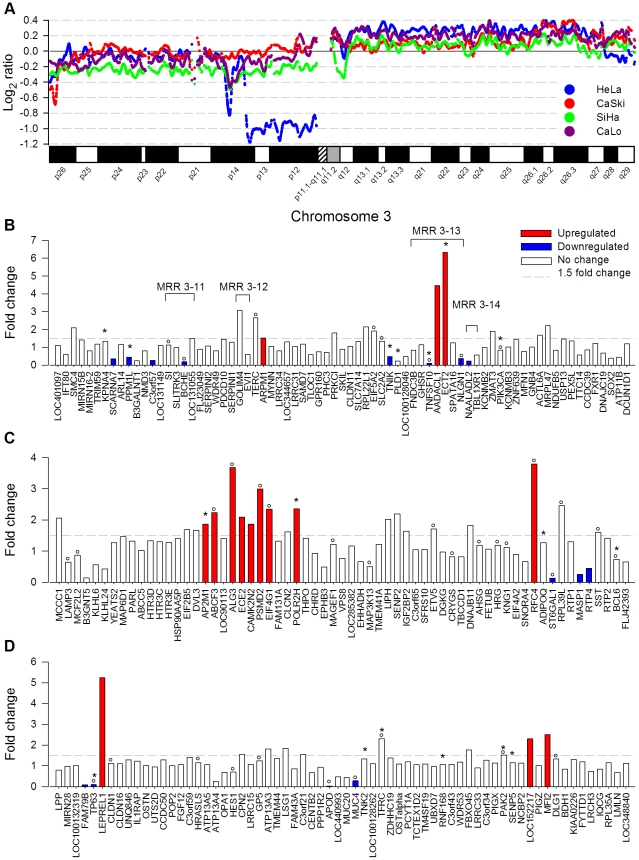
Figure 6. Genome amplification and deregulation of gene expression in 3q.
Panel A shows the copy number log2 ratio of SNPs investigated in Chr 3 by the 100 K SNP microarray in HeLa, CaSki, SiHa, and CaLo. Panels B to D show the fold change of gene expression of genes evaluated by the ST1.0 expression microarray located at 3q26 (n = 73), 3q27 (n = 63), and 3q28–29 (n = 66). The genes are ordered according to the position in the genome. See the legend of Figure 2 for further information.

