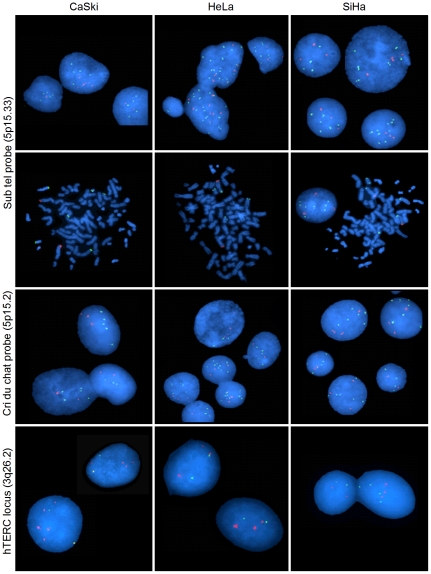
Figure 8. Copy number analysis of cytobands 5p15 and 3q26 with fluorescence in situ hybridization (FISH).
Representative experiments of FISH analysis of cytobands 5p15.33, 5p15.2, and 3q26 in 3 cell lines (CaLo, CaSki, and HeLa) are shown. Two sets of probes were used for the analysis of 5p15 and one for the analysis of 3q26 (see Materials and Methods). The sets for 5p15 included a target probe (green signals) and a control probe (red signals) located at 5q. The set for 3q26 included a target probe (green signals) and a control probe located at the centromere. Nuclei in interphase (first, third, and fourth rows) and Chr in metaphase (second row) were counterstained with DAPI.

