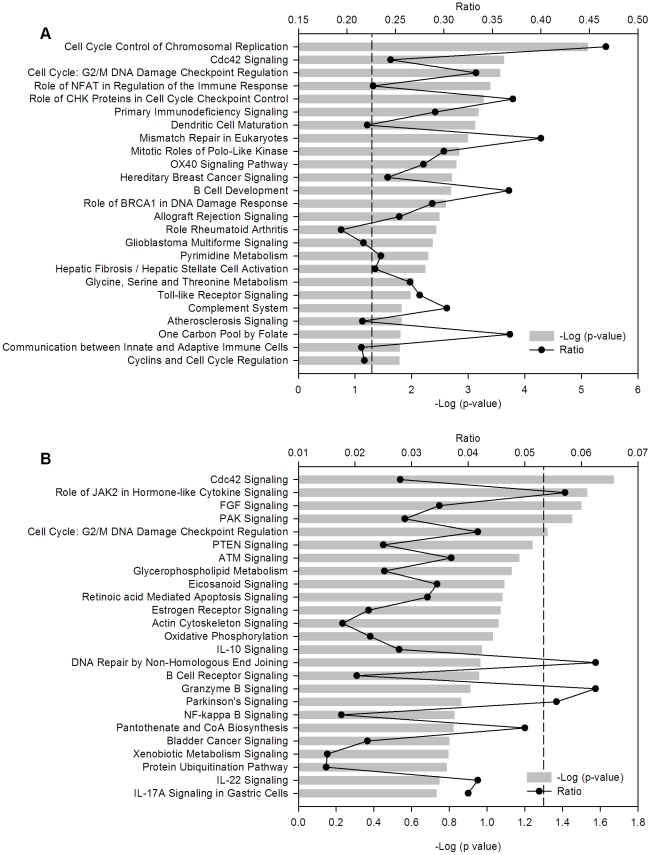
Figure 9. Canonical pathways where deregulated genes are involved.
Top 25 canonical pathways identified in the set of 3,122 genes deregulated in the four cell lines (A) and in the subset of 147 deregulated and recurrent CN-altered genes (B). The canonical pathways were identified with the Ingenuity Pathway Analysis (IPA) system. The −log (p-value), gray bars, and the ratio, black dots, were calculated comparing the number of genes of the pathways present in the datasets versus the human database. The p-value was calculated with the chi square or Fisher exact tests as appropriate and the values of −log (p-value)>1.3 (dash line) correspond to p<0.05.

