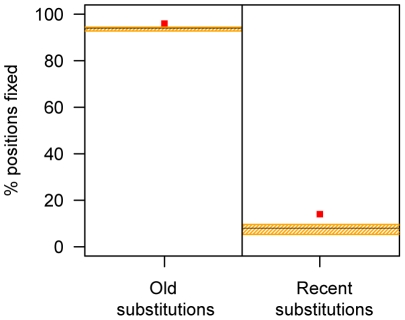
Figure 3. Percentages of fixed positions for old and recent substitutions.
The red points show the percentages calculated for HARs, the horizontal black line shows the genome-wide percentage, and the orange shaded areas show 95% confidence intervals for the genome-wide percentage calculated from an empirical distribution after randomly sampling genome-wide HAR-sized elements 1,000 times.

