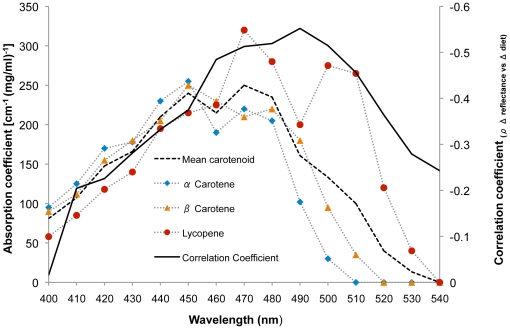
Figure 5. Diet-linked skin reflectance changes track common carotenoids.
Solid black line - Spearman correlation coefficients (ρ Δ reflectance vs Δ diet) of the relationships between fruit and vegetable consumption change (from week 0 to 6) and average skin reflectance change. Dashed bold line shows the mean absorption spectra [cm−1 (mg/ml)−1] for three common carotenoids, which are individually plotted (blue rhombi - α-carotene, orange triangles - β-carotene and red circles - lycopene).

