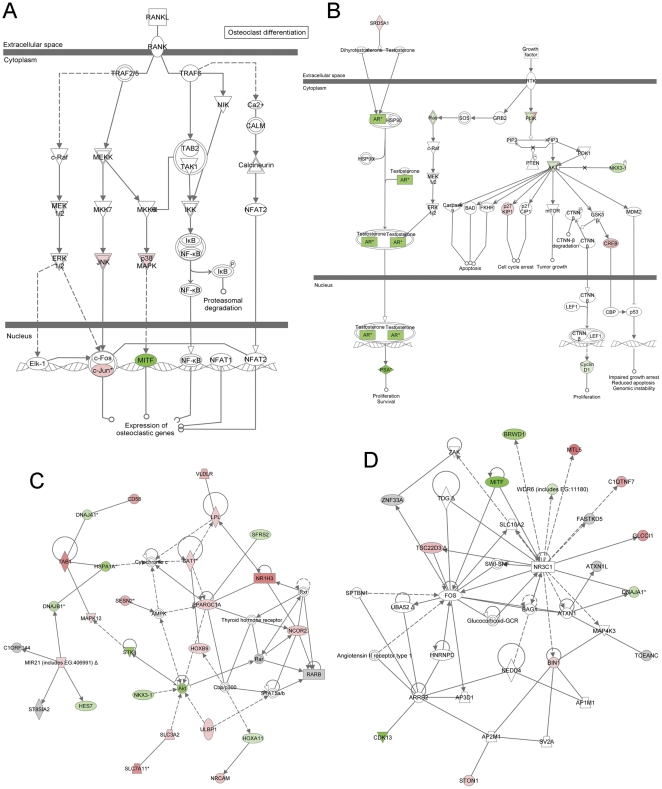
Figure 5. IPA network analysis.
BR-DIM regulated the molecules in RANKL signaling (A), prostate cancer signaling (B), and signal transduction networks (C, D) analyzed by microarray and Ingenuity Pathway analysis in C4-2B cells. Red indicates up-regulated molecules while green specifies down-regulated molecules. The figures were automatically created by Ingenuity Pathway Analysis software.

