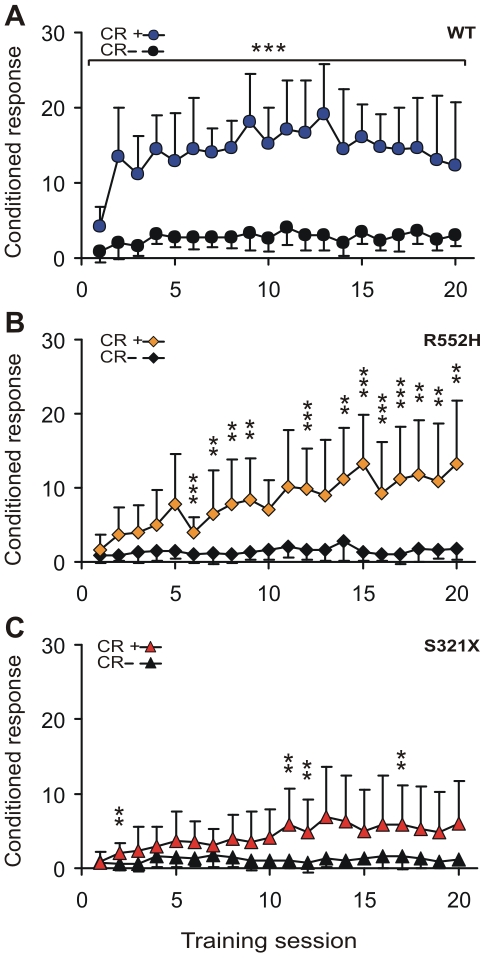
Figure 1. Learning curves of wildtype (a), heterozygous R552H mutant (b), and heterozygous S321X mutant (c) mice.
For all 20 training days (one training session per day) the mean numbers of jumps across the hurdle averaged from the performances of the 11 animals per experimental group are shown. The animals could show hits (CR+) in the presence of 12 kHz tones or false alarms (CR−) in the presence of 7 kHz tones. Since each training session consisted of 60 trials with 30 randomized presentations of both CS+ and CS− a maximum of 30 hits and 30 false alarms could be reached if the animals responded to each tone with a jump, irrespective of the tone frequency. The larger the distance is between the CR+ and CR− curves the better is the learning performance. Standard deviations of the means are shown only for one side to improve readability of the data. Statistically significant differences between the CR+ and CR− rates calculated for each training session are indicated as ** p<0.01; *** p<0.001.

