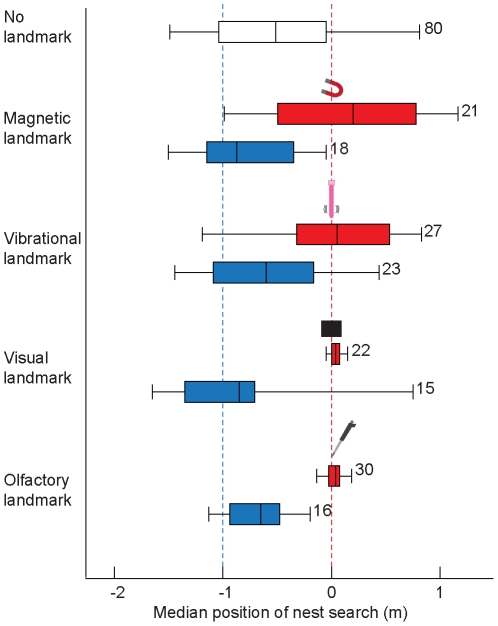
Figure 3. Ants learn magnetic, vibrational, visual and olfactory landmarks.
Box plot representation of the medians of the first six turning points of ants that were trained and tested with a landmark (red boxes), control ants trained and tested without a landmark (white box), and naïve ants that experienced the landmark during the test for the first time (blue boxes). Blue dashed line, nest position as defined by path integration; red dashed line, nest position as defined by landmark. Box plots show median, interquartile range and whiskers indicating the 90th and 10th percentiles. Kruskal-Wallis test and Dunn's multiple comparison tests were performed for selected pairs: control (training and test without landmark) versus naïve ants (landmark only during test), for each landmark type P>0.05; ants trained and tested with the landmark versus naïve ants, for each landmark type P<0.05; ants trained and tested with the landmark versus control ants, for each landmark type P<0.05. Numbers depict sample sizes.

