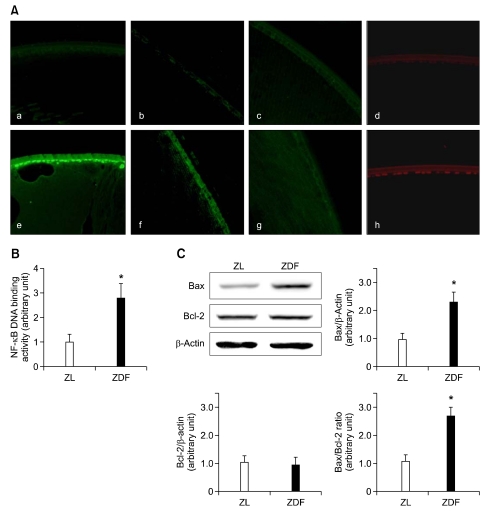
Figure 2.
NF-κB activation and expression of Bax and Bcl-2 in LECs. (A) Immunofluorescence staining of NF-κB (a, d), Bax (b, e) and Bcl-2 (c, f). Representative photomicrographs of lenses from the normal ZL rat (a-c) and ZDF rat (d-f). Positive signals (green) for activated NF-κB are mainly detected in the nucleus of diabetic LECs. The lens epithelium of ZDF rats shows strong immunoreactivity for Bax. However, Bcl-2 immunoreactivity does not differ between normal and diabetic rats. The scale bar = 50 µm. (B) Analysis of NF-κB DNA binding activity by an ELISA-based assay. (C) Expression of Bax and Bcl-2 protein by western blotting and the ratio of Bax to Bcl-2 protein expression levels. Values in the bar graphs represent means ± SE, n = 8. The asterisk (*) indicates a value of P < 0.01 vs. normal ZL rats.

