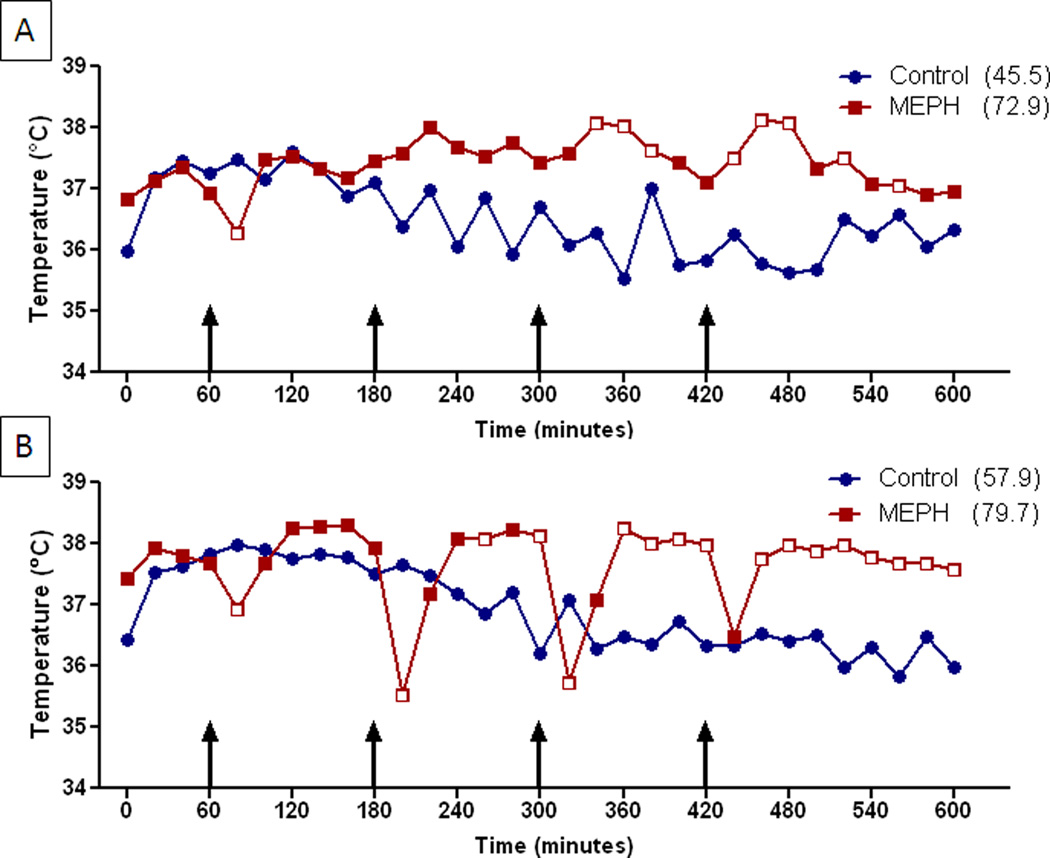
Fig. 5.
Effects of MEPH on core body temperature. Mice (n = 6 per group) were treated with 4X 20 mg/kg (A) or 4X 40 mg/kg (B) and core body temperatures were recorded by telemetry at 20 min intervals for 9 h after the first injection. Results are presented as group means. SEMs are omitted for the sake of clarity and were always < 10% of the respective mean values. Injections of MEPH are indicated by arrows. Areas under the curve (AUC) for MEPH treatment groups were calculated using GraphPad Prism 5 with respect to an arbitrary baseline set to 35°C for each group and are presented in parenthesis after each treatment condition. The main effects of 4X 20 mg/kg MEPH (A) and 4X 40 mg/kg MEPH (B) and their interaction were significantly different (p < 0.0001 for each; two-way repeated measures ANOVA). Significant differences between drug and controls at individual time points (p < 0.05, Bonferroni’s test) are indicated by open red symbols ( ) whereas those that do not differ are closed red symbols (
 ).
).

