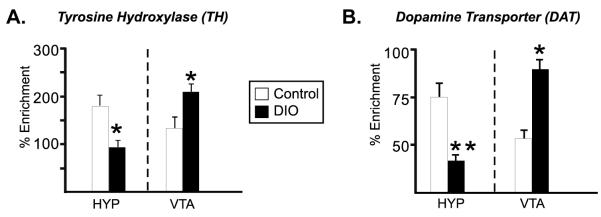
Figure 3. DNA methylation status of TH and DAT promoters in DIO mice.
Genomic DNA was isolated from dissected HYP and VTA of control (white bars) and obese (DIO) mice (black bars), sheared by sonication and immunoprecipitated with 5-methylcytosine antibody. The enrichment of DNA methylation relative to input genomic DNA in the promoter region of TH or DAT was quantified by qPCR. DIO mice displayed decreased methylation of TH and DAT within the HYP. The opposite effect was observed in the VTA, with both promoters showing significantly more methylation. GAPDH methylation was not altered in DIO mice (data not shown). Values are mean ± s.e.m. *p <0.05, **p< 0.01, n=6/group, Two-tailed t-test.

