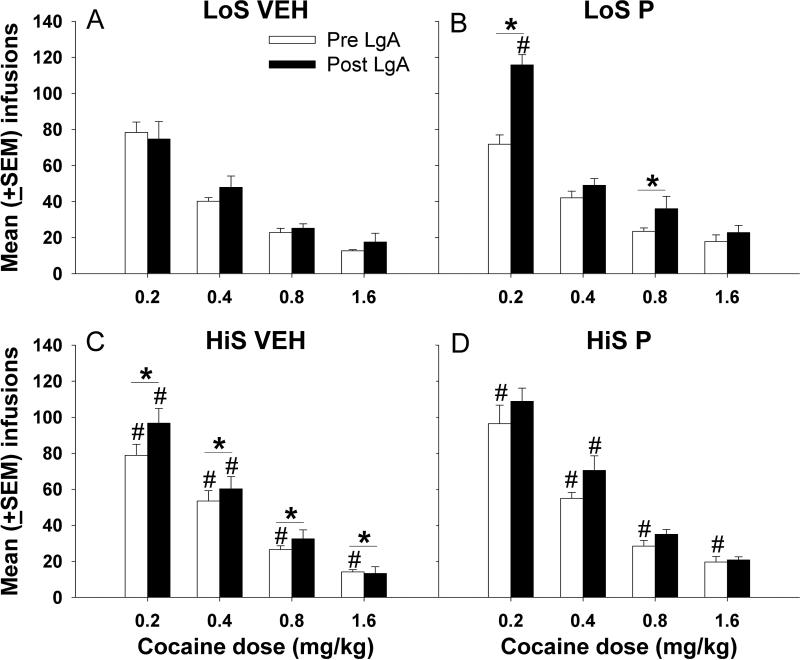
Figure 1.
Mean (±SEM) cocaine infusions obtained under the pre- and post-LgA dose-response conditions for the four groups. # denotes a significant phenotype difference for the respective dose and LgA (pre or post) condition (p<0.05). * indicates a significant within-subject difference between pre- vs. post-LgA conditions (p<0.05).

