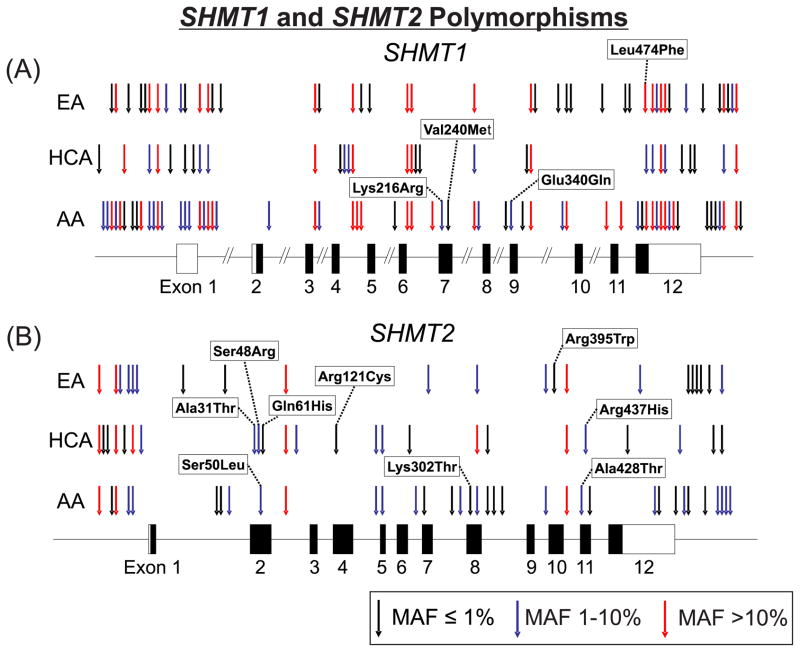
Figure 2.
SHMT1 and SHMT2 genetic polymorphisms. Arrows indicate the locations of polymorphisms identified during the resequencing of (A) SHMT1 and (B) SHMT2 for each of the three populations studied. MAFs are indicated by the color of the arrows. Black rectangles indicate exons that include coding sequence, while white rectangles are exons or portions of exons that encode 5′- and 3′-UTR sequence.

