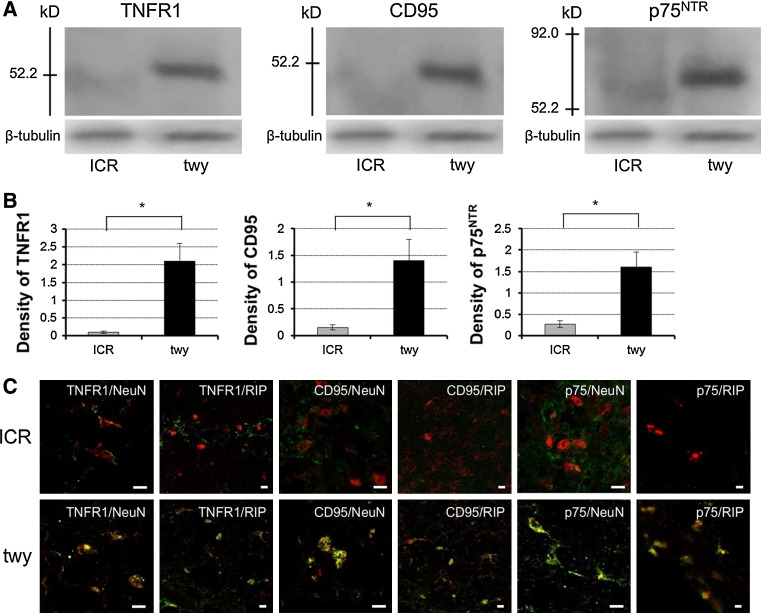
Fig. 4.
Immunoblot analysis showing expression of TNFR1, CD95 and p75NTR (a) and photomicrographs of double-staining immunofluorescence (c). The intensity of the band in 24 weeks twy/twy mice (upper right on each panel, a) was significantly increased compared to that in ICR mice. Graphs indicate the band intensities relative to that of β-tubulin (b). The intensity of TNFR1, CD95 and p75NTR in the twy/twy mice was significantly higher than that of ICR mice. Data are mean ± SEM (n = 3). *P < 0.05. Photomicrographs show representative double-stained immunofluorescence in the gray and white matter of 24 weeks twy/twy and ICR mouse at the site between C2 and C3 dorsal roots (maximal compression site in twy/twy mouse) for TNFR1/NeuN, /RIP, CD95/NeuN, /RIP and p75NTR/NeuN, /RIP. Note the double-positive cells in twy/twy mice. Scale bar 10 μm (c)

