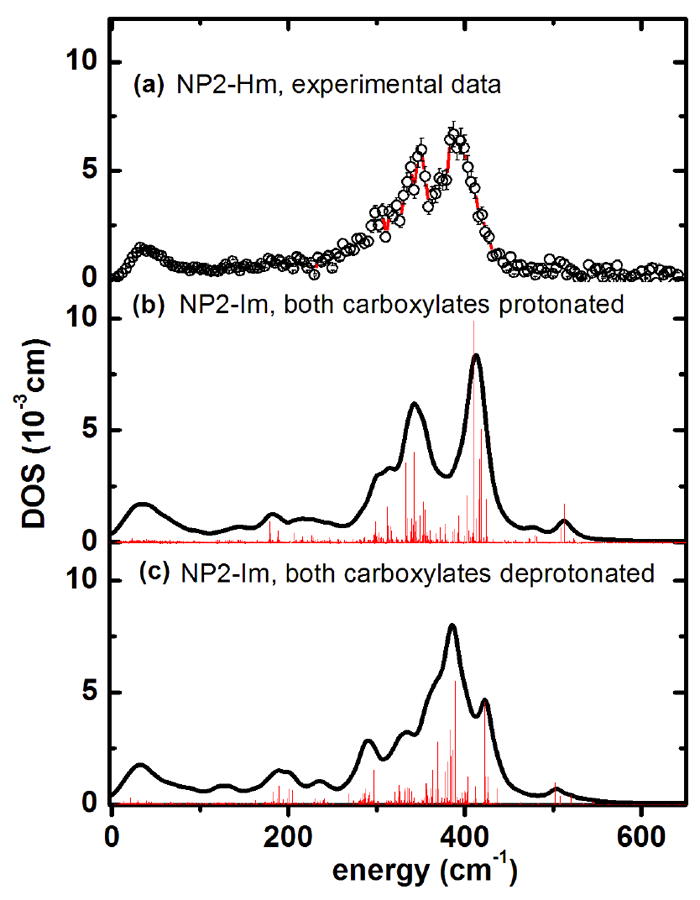
Figure 11.

Iron vibrational density of states obtained from calculations for NP2–Hm (a) experimental data. (b) Simulation of NP2–Im with the ONIOM approach127 with both heme carboxylates protonated, and (c) with both heme carboxylates deprotonated. The bar graphs display the calculated mode composition factor e2, scaled by a factor of 0.11. The possibility that the experimental spectrum (DOS) could be a superposition of protonated and deprotonated forms cannot be excluded.
