Figure 2.

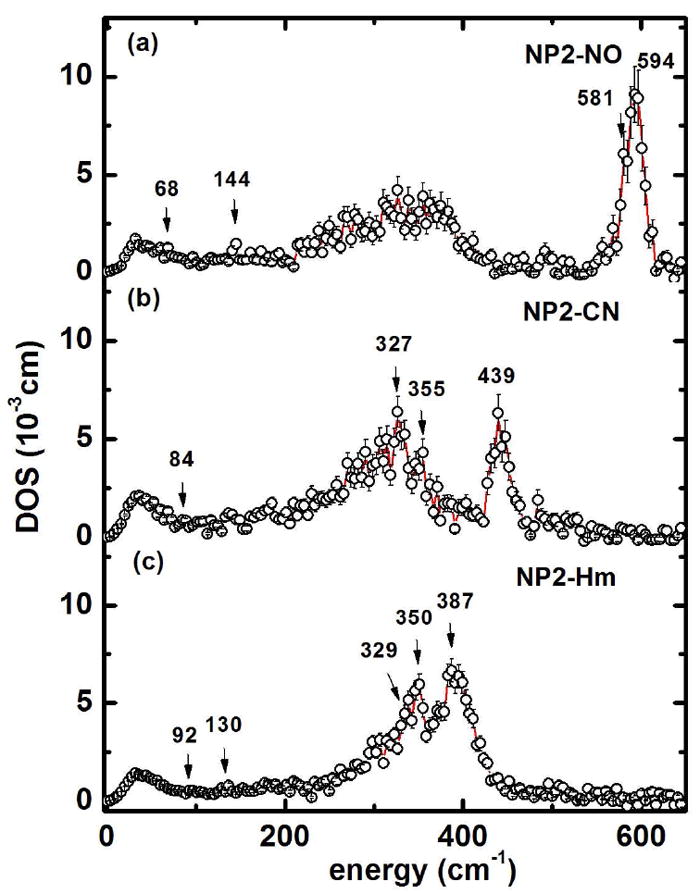
Iron density of states obtained from the experimental NIS spectra in Figure 1, from top to bottom: (a) NO-bound (NP2–NO), (b) CN--bound (NP2–CN), (c) Histamine-bound (NP2–Hm). The solid lines are guides to the eye.

Iron density of states obtained from the experimental NIS spectra in Figure 1, from top to bottom: (a) NO-bound (NP2–NO), (b) CN--bound (NP2–CN), (c) Histamine-bound (NP2–Hm). The solid lines are guides to the eye.