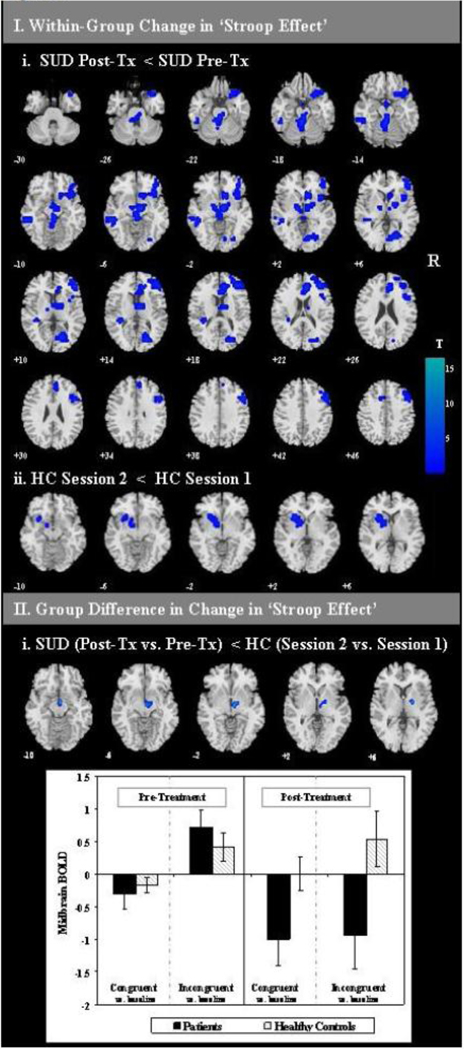
Figure 1. Change in fMRI ‘Stroop-effect’.
I. Change in fMRI BOLD signal across sessions on Stroop-effect (incongruent vs. congruent trials) contrast is displayed. Slice locations are indicated by MNI z levels. R: right side of brain images. Tx: treatment. Color bar indicates size of effect in t-values where blue tones indicate relative decreases in BOLD signal. i. Within-group changes across sessions were assessed with paired t-tests and a threshold of voxel-level p<0.005 with conjoint cluster-level pcorrected<0.05. ii. Group differences in change scores were assessed with a two sample t-test comparing change in BOLD signal activity following treatment (or re-test) masked for regions engaged by the SUD group at pre or post-treatment to a threshold of voxel-level p<0.005 and conjoint cluster extent of k=19. This cluster of significant interaction was saved as a mask in xjview and the mean signal intensity was extracted from the cluster mask region for incongruent vs. baseline and congruent vs. baseline contrasts from each participant at each session. The bar graph illustrates group means (±1 standard error of the mean) of the mean signal intensity from the cluster from each contrast at each time point.

