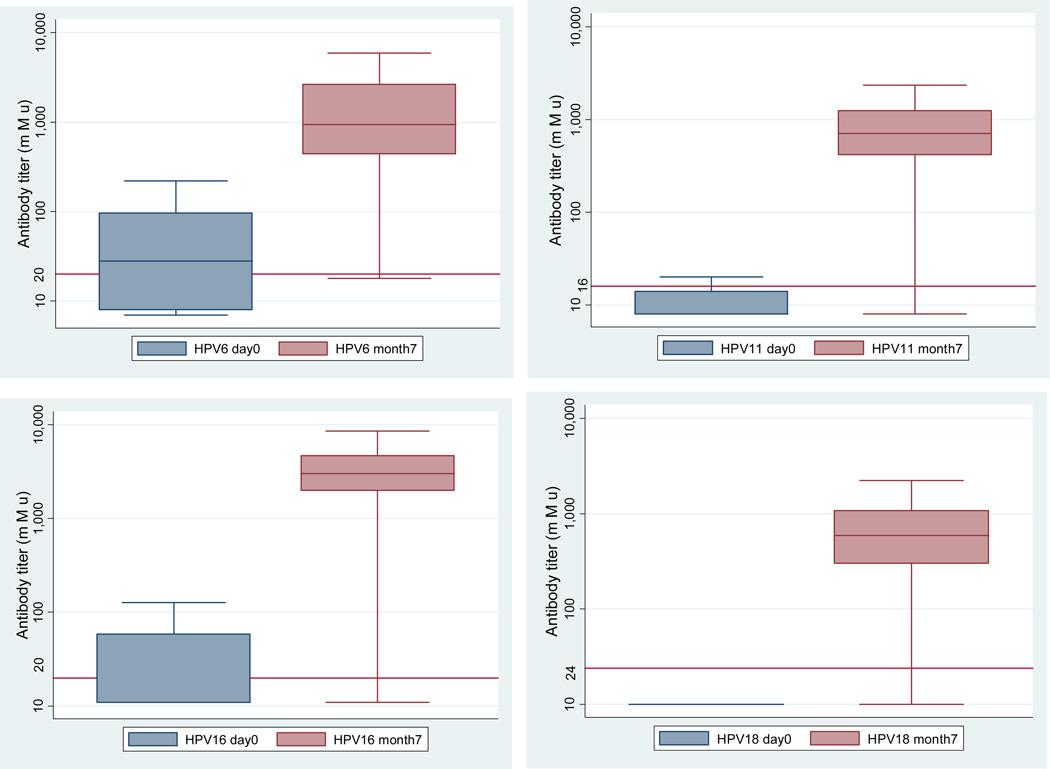
Figure 2.
Antibody levels at baseline and 1 month following final vaccine dose by genotype among 182 FSWs in Lima, Peru.
Horizontal lines represent antibody cutoffs for seropositivity
The box contains 25th to 75th percentile, and the upper bars are 95%
Statistically significant differences between antibody levels at day0/month7 P<.01

