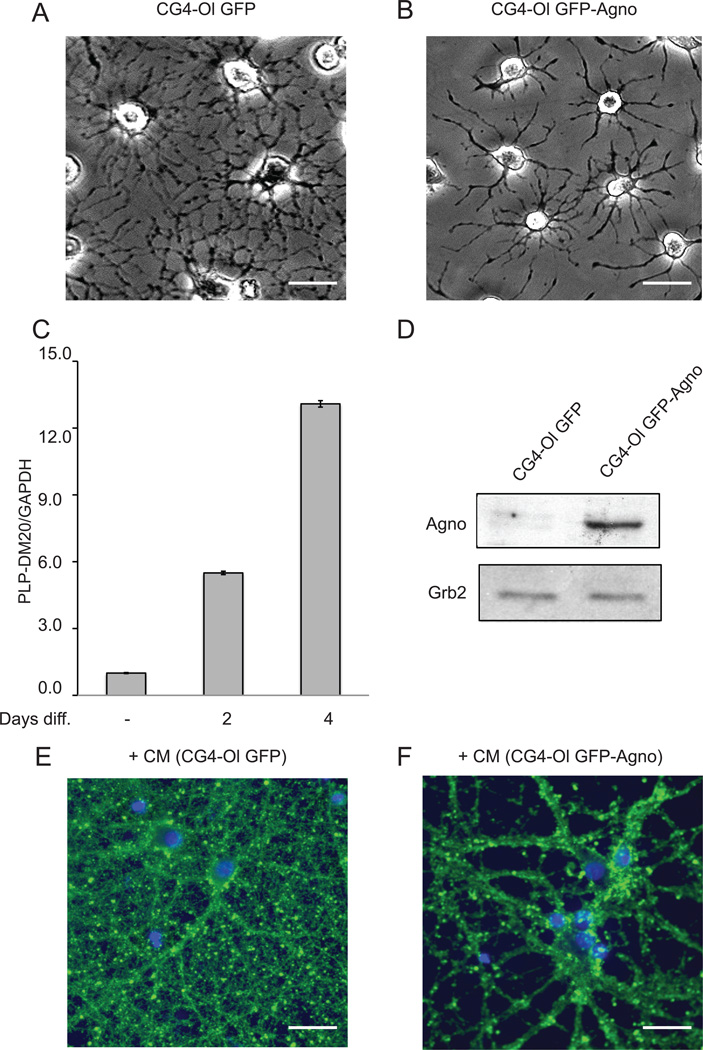
Figure 1. Structural alterations in rat cortical neurons exposed to CM from CG4-Ol constitutively expressing JCV agnoprotein.
A and B. Phase-contrast images of CG4 cells expressing GFP and GFP-Agno induced to differentiate into oligodendrocyte lineage. Scale bar, 20 µm. C. Quantification of levels of mRNAs for PLP and DM-20 by QPCR. Relative levels of mRNAs from CG4 cells, un-induced and induced to differentiate into oligodendrocytic lineage for 2 or 4 days, were expressed as the ratio to the number of the target gene copies relative to the number of reference gene glyceraldehyde-3-phosphate-dehydrogenase (GAPDH) copies and was referred as arbitrary units. D. Immunoblot analysis demonstrating the presence of GFP-agnoprotein using an antibody against agnoprotein. The position of the GFP-Agnoprotein band (35 kDa) is indicated by an arrow. Grb2 serves as a loading control (low panel). E and F. Rat cortical neurons isolated from rat embryos (E17) were incubated with CM from CG4-Ol cells expressing GFP or GFP-Agno. After 16 hours of incubation, neurons were fixed and immunolabeled with antibody to class III β-tubulin (green fluorescence). Nuclei were counterstained with DAPI (blue). Scale bar, 20 µm.

