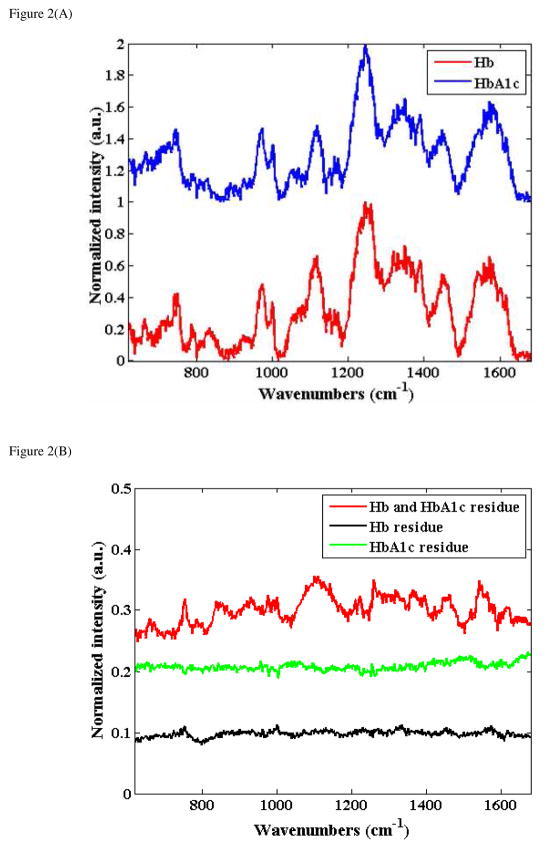
Figure 2.
Figure 2(A) Representative Raman spectra acquired from the drop-coated single protein Hb and HbA1c samples derived from ca. 39 μM and 34 μM solutions, respectively (the spectra are normalized and offset for the sake of clarity).
Figure 2(B): Spectra computed from the difference between: normalized Hb (39 μM) and HbA1c (34 μM) spectra shown in Fig. 2(A) (red); normalized Hb spectra from drop-coated rings derived from 39 μM and 19.5 μM (green); normalized HbA1c spectra from drop-coated rings derived from 34 μM and 17 μM (black).

