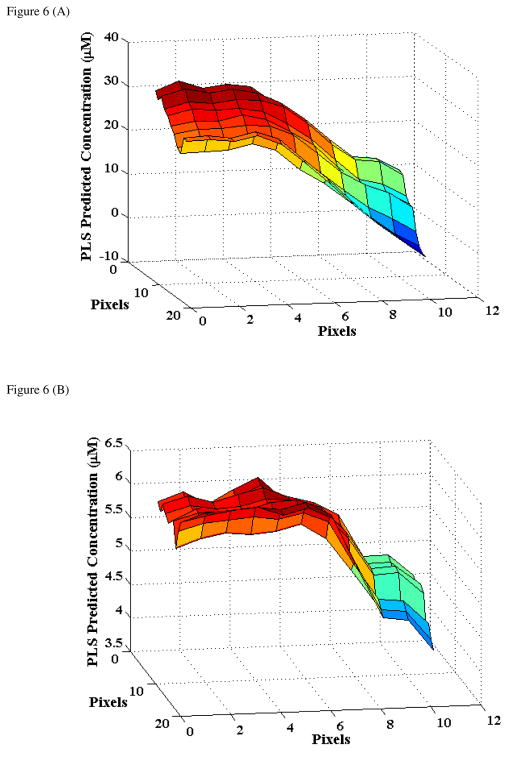
Figure 6.
2D spatial Raman mapping based concentration prediction results for a representative hemolysate model for: (A) Hb and (B) HbA1c. The reference Hb and HbA1c concentrations are 25.9 μM and 5.6 μM, respectively, for this sample. The field of view is 44×44 μm with a pixel-to-pixel distance of 4 μm.

