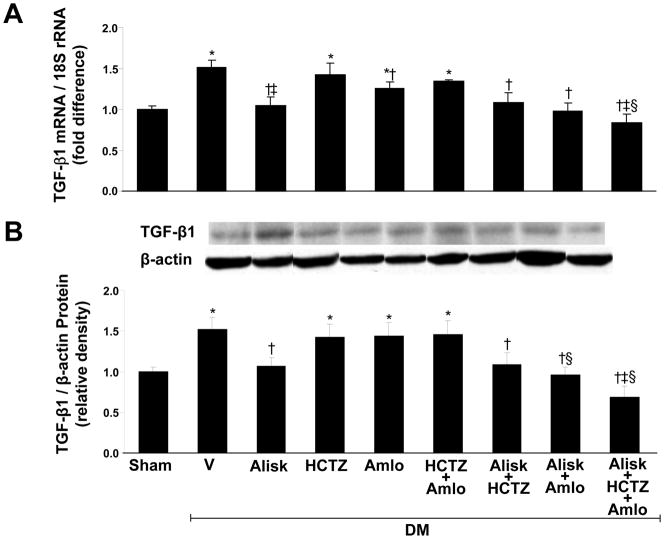
Figure 3.
Renal expression of transforming growth factor-beta1 (TGF-β1) in kidneys of sham and streptozotocin-induced diabetic (DM) rats treated with vehicle (V), aliskiren (Alisk), hydrochlorothiazide (HCTZ), amlodipine (Amlo), and their combination. A, mRNA levels of TGF-β1. B, Western blot analyzes of TGF-β1. Top, Representative blots. Bottom, Quantitative results normalized to β-actin. n=5, each group. Data are mean ±SEM. *P<0.05 vs. control; †P<0.05 vs. DM+V; ‡P<0.05 vs. DM+HCTZ; §P<0.05 vs. DM+Amlo.

