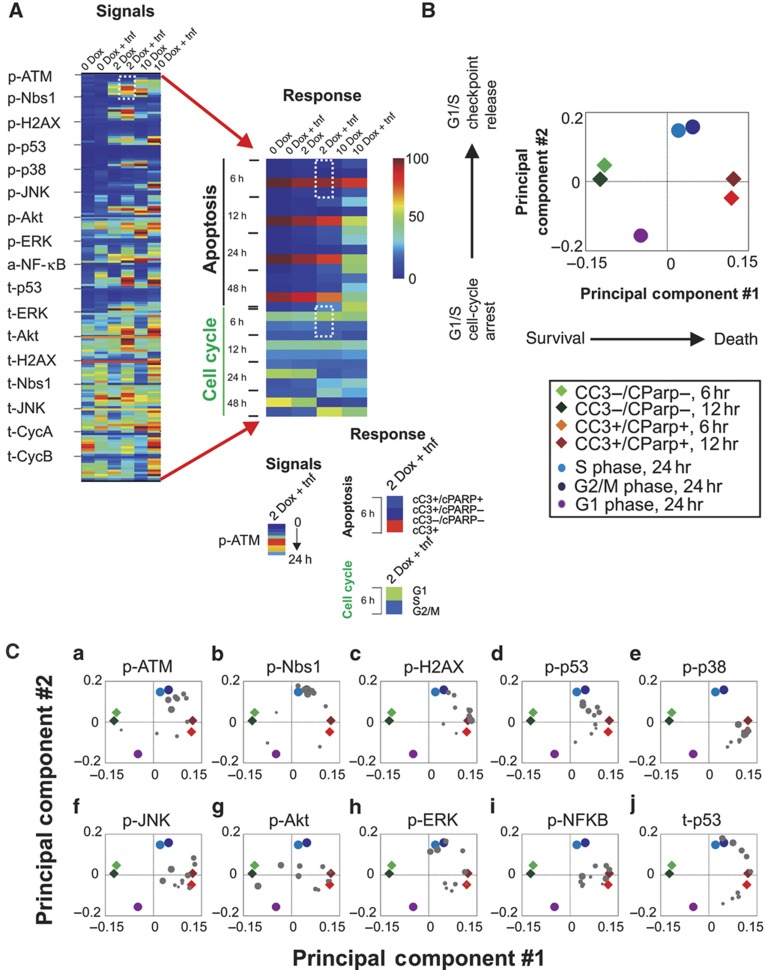
Figure 5.
PLSR maps signaling events onto cell death versus cell cycle progression axes. (A) Signaling and cellular-response heatmaps for all six treatment conditions investigated. In the heatmap representation of the signaling data, the mean values for each indicated signal, measured at each of the 10 time points, are time ordered from top to bottom in each column. For each signal (t denotes total level, p denotes the phospho-form, and a denotes DNA-binding activity), the measured values across all six conditions were normalized to the maximal value ever observed under any condition, and color coded from low (blue) to high (red) activity. The heatmap of the cell response data shows mean values for the four indicated parameters of cell survival/death (% of cells that are cC3+/cPARP+; cC3+/cPARP−; cC3−/cPARP–; and cC3+ regardless of cPARP status), and three measurements of cell-cycle state (G1, S, and G2/M), color coded by absolute percentage as indicated in the color bar at right. (B) Loadings of cellular responses at the indicated time points plotted in the PC space defined by the PLSR model. The cellular responses of apoptosis (cC3+/cPARP+) at 6 and 12 h following treatment, survival (cC3−/cPARP−) at 6 and 12 h following treatment and measures of the G1, S, and G2–M cell-cycle populations at 24 h following treatment are plotted in the PC space based on the weights of each of the cellular responses in PC1 and PC2. Apoptotic responses measured at 6 and 12 h following treatment (red and maroon diamonds, respectively) are positively correlated with PC1, while survival responses measured at 6 and 12 h following treatment (green and dark green diamonds, respectively) are negatively correlated with PC1; PC1 can therefore be interpreted as a ‘Survival–Death’ axis. Measurements of S and G2–M cell-cycle populations at 24 h following treatment (blue and dark blue circles, respectively) are positively correlated with PC2, while measurement of the G1 population at 24 h following treatment (purple circle) is negatively correlated with PC2, consistent with PC2 as a ‘Cell-cycle regulation’ axis. (C) Loadings of signaling measurements (gray circles) for the indicated molecules are plotted in PC space, along with the cellular responses. Increasing symbol size denotes increasing time from 0.25 to 24 h following treatment. Source data is available for this figure in the Supplementary Information.

