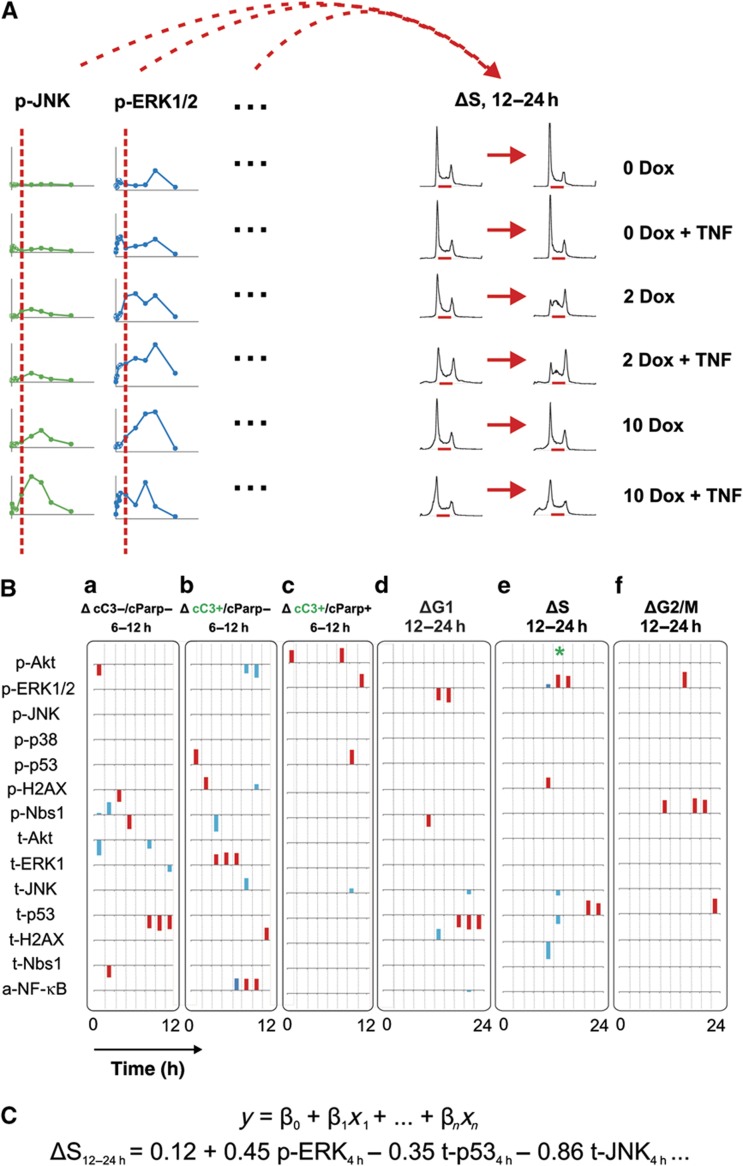
Figure 6.
Time-interval stepwise regression identifies a role for early and intermediate ERK signaling in G1/S arrest and G1/S induced cell death after DNA damage. (A) Illustration of the TI-SWR method. TI-SWR posits that a subset of molecular signaling events measured at a given time point are related in a causal fashion to the change in a cellular phenotypic response measured over a later time interval. In this example, the change in the S-phase population between 12 and 24 h is the dependent variable, and the independent variable set includes all signaling measurements taken at the 4-h time point. (B) Sparkline representation, grouped by signal, of correlations identified using TI-SWR between time-dependent molecular events and cell-death responses (a–c) or cell-cycle responses (d–f). Bar direction reflects the sign of the correlation coefficient, and bar height indicates the strength of the correlation (calculated as [(R2 × 100) × (5(regression degree−1)]), where R denotes the initial regression coefficient (primary correlate) or the improvement in regression coefficient (secondary correlates) from the prior model. Red bars indicate primary correlates (regression degree=1), blue bars indicate secondary correlates (regression degree 2 or 3). Signaling measurements at 4 h implicated in S-phase progression between 12 and 24 h are shown in (e) beneath the asterisk. The final regression model is shown in (C).

