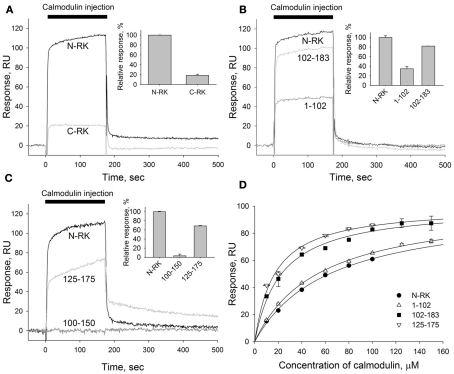
Figure 3.
Mapping of the calmodulin binding site in the N-terminal region of RK. (A–C) A representative overlay of SPR sensorgrams showing real-time binding of calmodulin to RK fragments anchored on the sensorchip surface via GST tags using anti-GST antibodies covalently coupled to the dextran matrix. Sixty micromolar calmodulin in running buffer containing 2 mM Ca2+ was injected over the surfaces with immobilized N-terminal or C-terminal regions of RK (termed N-RK and C-RK, respectively) (A), N-RK and its fragments corresponding to the residues M1-L102 and L102-G183 (B), or N-RK and its fragments corresponding to the residues D100-V150 and F125-K175 (C). The sensorgrams were normalized to the amounts of immobilized fragments, and the reference signal from a control surface with immobilized GST was subtracted. Insets show relative responses at the end of the injection observed for each GST–RK fragment indicating the amount of calmodulin bound. (D) Steady-state affinity analysis of calmodulin binding to the full-length N-RK or its fragments M1-L102, L102-G183, or F125-K175. Binding of calmodulin was recorded at concentrations ranging from 10 to 150 μM. The amplitudes of binding signals at equilibrium were determined, normalized, and are shown as a function of calmodulin concentration. Apparent KDs were determined as half-maximal calmodulin concentrations required for saturation of SPR amplitudes as described under Section “Materials and Methods.” The obtained values for N-RK, M1-L102, L102-G183, and F125-K175 are 63 ± 3, 54 ± 2, 23 ± 2, and 17.0 ± 1.5 μM, respectively. Data points represent mean ± SE of the mean from two independent experiments. The calculated KDs are expressed as best-fit value ± SE of the fit.

