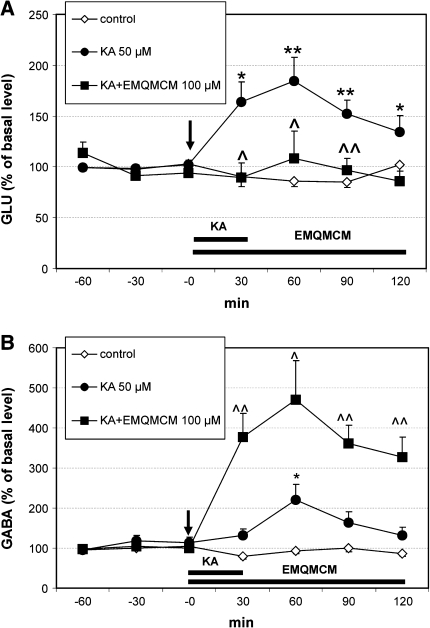
Fig. 6.
Effect of EMQMCM (100 μM) and kainic acid (KA 50 μM) on extracellular GLU (a) and GABA (b) level in the rat hippocampus. EMQMCM and KA administration is indicated with an arrow, while horizontal bar shows duration of treatment. Data are means ± SEM (n = 4–10). Repeated measures ANOVA and Tukey’s post hoc test. *P < 0.05, **P < 0.01 in comparison with control; ^P < 0.05, ^^P < 0.01 in comparison to group treated with KA

