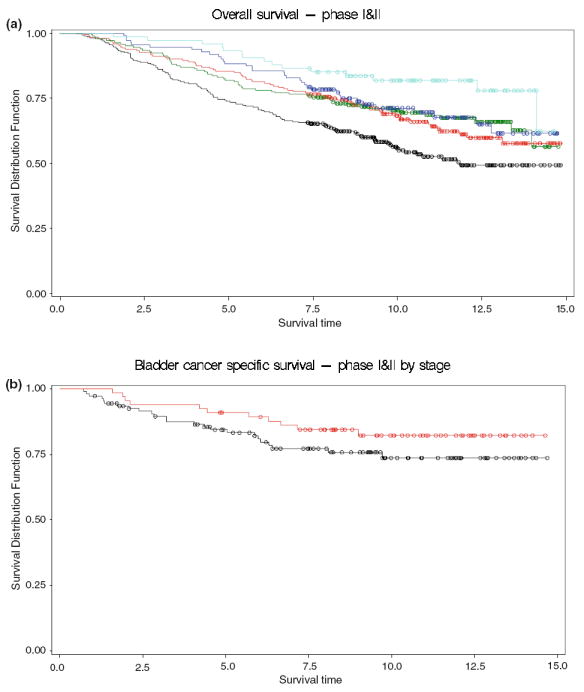
Fig. 1.

a Overall survival by toenail arsenic level. Kaplan–Meier plots show survival of bladder cancer cases (y-axis) plotted over time in years (x-axis). The colored lines depict cases based on toenail arsenic level (light blue 90th percentile and greater, dark blue 75th–90th, green 50th –75th, red 25th–50th, while black shows all cases below the 25th percentile cutoff (log-rank test: p values < 0.001). b Bladder cancer cause-specific survival for invasive tumors by toenail arsenic level. Kaplan–Meier plots show survival of bladder cancer cases (y-axis) plotted over time in years (x-axis). The red line depicts cases with a toenail arsenic level in the 75th percentile and greater, while black shows all cases below the 25th percentile cutoff (Log-rank test: p values = 0.19)
