
Figure 1.
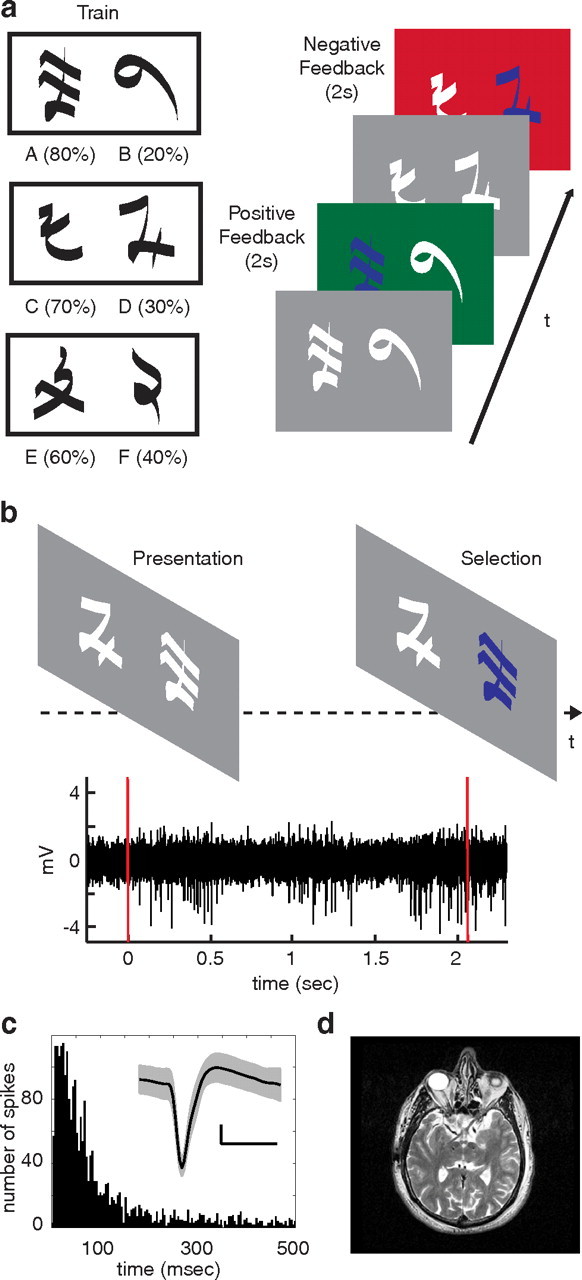
Probability learning and decision task. a, In the learning task, three pairs of symbols (denoted here by pairs of letters: AB, CD, EF) are presented in random order. Participants are instructed to choose one of the two stimuli on each trial. Reward rates for each symbol are randomly assigned and fixed throughout the experiment. Probabilistic feedback follows each choice for 2 s. Positive feedback is indicated with a green screen and an audible ring of a cash register. Negative feedback is indicated with a red screen and an audible buzz. b, In the decision task, participants are presented with combinations of all symbols and instructed to choose one of the two symbols presented on each trial. No feedback indicating whether the choice was correct is presented. Microelectrode recordings are captured from STN during the decision task. The bottom panel represents a typical bandpass filtered STN recording during a single trial of the decision task. Red lines indicate stimulus presentation and button selection. c, Histogram of interspike intervals from one spike cluster. Inset, Mean waveform of this spike cluster is shown in black, with SD in gray. Calibration: 10 mV, 0.5 ms. d, Postoperative axial MRI demonstrates final placement of DBS leads in bilateral STNs for one participant.