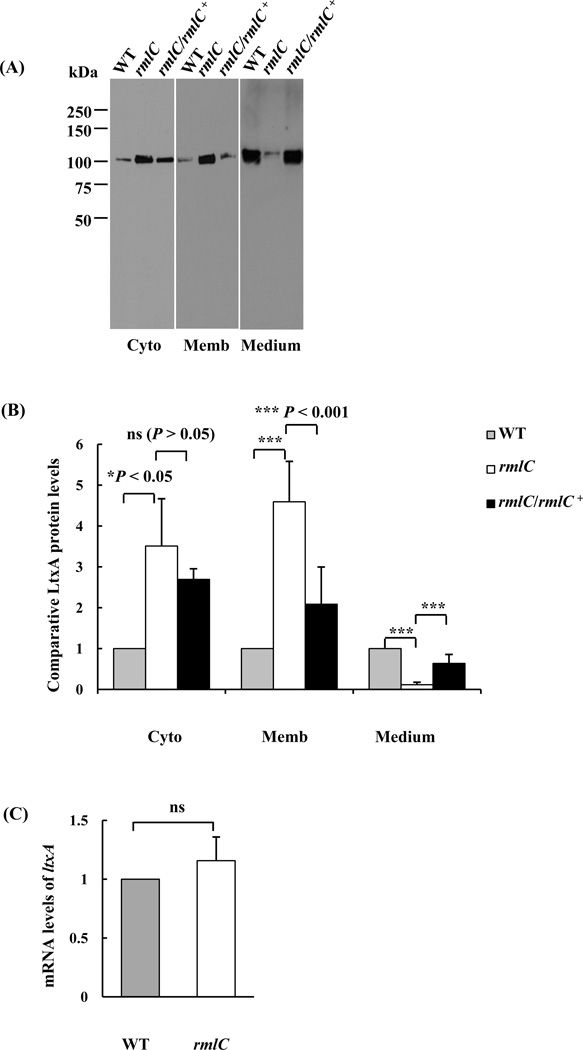
Figure 2. Analysis of leukotoxin in the cytoplasm, membrane, and growth medium.
(A). Immunoblot analysis. Equivalent amounts of proteins from the cytoplasm (Cyto), membrane (Memb) and culture medium (Medium) of the wild type (WT), the rmlC mutant (rmlC) and the complemented strain (rmlC/rmlC+) were separated, transferred to PVDF, and probed with anti-LtxA antibody. (B). Quantification of leukotoxin (LtxA). The integrated intensity of each band in panel A, which represents the relative protein level, was quantified using the ImageJ program and analyzed using One-way ANOVA. The signal intensity of the wild type in each fraction was arbitrarily set as 1.0. (C). Quantitative, real-time, reverse transcriptional-PCR analysis of ltxA mRNA levels. The relative mRNA levels of ltxA were calculated based on the threshold cycle (CT): relative expression level= 2−ΔΔCT with ΔΔCT=CT(ltxA)-CT(16s rRNA)-CT(calibrator). The wild-type strain VT1169 was chosen as the calibrator. (ns: nonsignificant, *P<0.05, ***P< 0.001)

