
Figure 1.
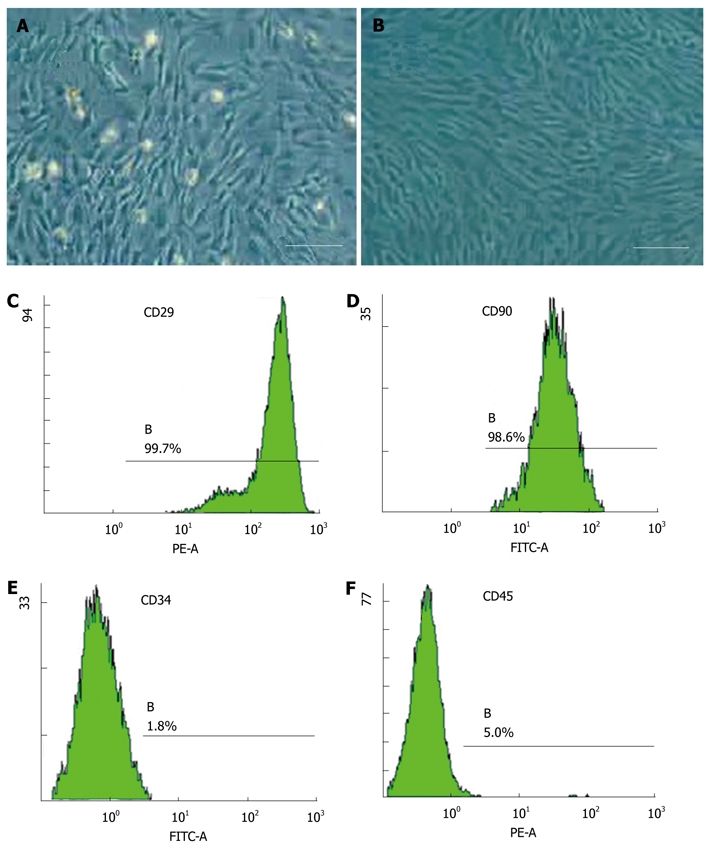
Mesenchymal stem cell culture and identification. A: The morphology of mesenchymal stem cell (MSC) culture at 3 d (10 × 10 magnification); B: The morphology of MSCs approached 80% confluence (10 × 10 magnification); C: Fluorescence-activated cell sorting (FACS) analysis for MSC positive cell marker CD29; D: FACS analysis for MSC positive cell marker CD90; E: FACS analysis for MSC negative cell marker CD34; F: FACS analysis for MSC negative cell marker CD 45. Scale bars represent 100 mm. FITC: Fluorescein isothiocyanate; PE: Phycoerythrin.