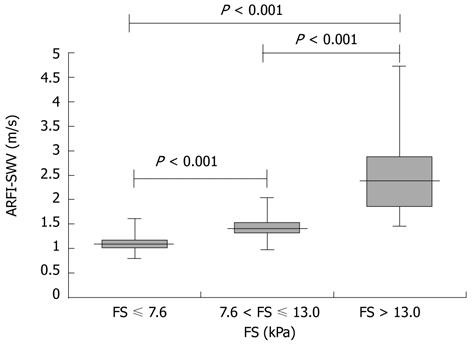
Figure 2.

Acoustic radiation force impulse imaging shear wave velocity for the different stages of fibrosis. Box plots show median values with 25th and 75th percentiles of shear wave velocity determined by acoustic radiation force impulse. (FS ≤ 7.6 kPa: No significant fibrosis; 7.6 kPa < FS ≤ 13.0 kPa: Significant fibrosis; FS > 13.0 kPa: Liver cirrhosis).
