Figure 1.

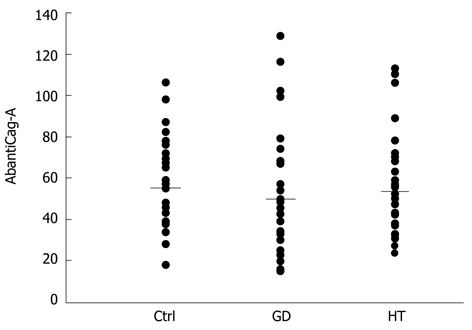
The AbantiCag-A levels are shown for the investigated groups. The bars show the different means. No significant difference was found among the different groups. GD: Graves’ disease; HT: Hashimoto’s thyroiditis.

The AbantiCag-A levels are shown for the investigated groups. The bars show the different means. No significant difference was found among the different groups. GD: Graves’ disease; HT: Hashimoto’s thyroiditis.