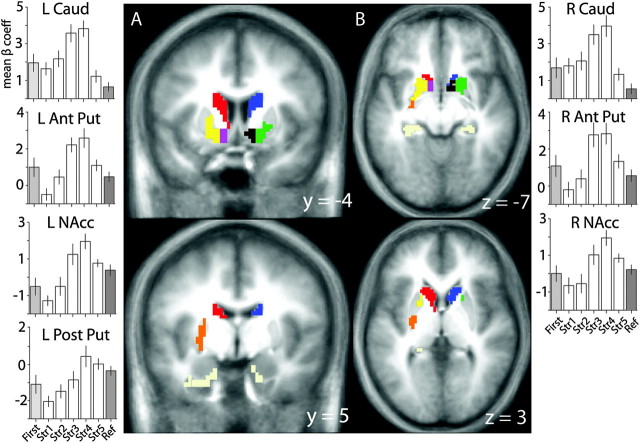
Figure 3.
Regions of striatum (A, coronal; B, axial) where activity varied over the course of learning. Activity in the anterior striatum tracked the rate of learning (a putative prediction error signal): left caudate (red), right caudate (dark blue), left anterior striatum (yellow), right anterior striatum (green), left NAcc (purple), and right NAcc (dark brown). Activity in the posterior striatum tracked the amount of information learned similar to MTL ROIs: left posterior putamen (orange). Regions in the MTL (pale yellow) also correlated with learning; these results are reported in the supplementary materials (Supplementary Fig. 5). Parameter estimates for the striatal ROIs are plotted above. Error bars represent the standard error of the mean. Colors represent ROI labels derived from group-level analysis. L, left; R, right; Caud, Caudate; Ant Put, anterior putamen; Post Put, posterior putamen.

